
Write Logs for Machines, use JSON
Published December 26th, 2011
Logging for Humans
A printf style format string is the de facto method of logging for almost all software written in the last 20 years. This style of logging crosses almost all programing language boundaries. Many libraries build upon this, adding log levels and various transports, but they are still centered around a formated string.
I believe the widespread use of format strings in logging is based on two presumptions:
- The first level consumer of a log message is a human.
- The programmer knows what information is needed to debug an issue.
I believe these presumptions are no longer correct in server side software.
An example of the problem
An example is this classic error message inside the Apache HTTP Server. The following code is called any time a client hits a URL that doesn’t exist on the file system:
{% highlight c %} aplogrerror(APLOGMARK, APLOGINFO, 0, r, “File does not exist: %s”, r->filename); {% endhighlight %}
This would generate a log message like the following in your error.log:
[Mon Dec 26 09:14:46 2011] [info] [client 50.57.61.4] File does not exist: /var/www/no-such-fileThis is fine for human consumption, and for decades people have been writing Perl scripts to munge it into fields for a computer to understand too. However, the first time you add a field, for example the HTTP User-Agent header, it would break most of those perl scripts. This is one example of where building a log format that is optimized for computer consumption starts to make sense.
Another problem is when you are writing these format string log messages, you don’t always know what information people will need to debug the issue. Since you are targeting them for human consumption you try to reduce the information overload, and you make a few guesses, like the path to the file, or the source IP address, but this process is error prone. From my experience in the Apache HTTP server this would mean opening GDB to trace what is happening. Once you figure out what information is relevant, you modify the log message to improve the output for future users with the relevant information.
What if we logged everything into JSON?
If we produced a JSON object which contained the same message, it might look something like this:
{% highlight javascript %} { “timestamp”: 1324830675.076, “status”: “404”, “shortmessage”: “File does not exist: /var/www/no-such-file”, “host”: “ord1.product.api0”, “facility”: “httpd”, “errno”: “ENOENT”, “remotehost”: “50.57.61.4”, “remoteport”: “40100”, “path”: “/var/www/no-such-file”, “uri”: “/no-such-file”, “level”: 4, “headers”: { “user-agent”: “BadAgent/1.0”, “connection”: “close”, “accept”: ”/” }, “method”: “GET”, “uniqueid”: “.rh-g2Tm.h-ord1.product.api0.r-axAIO3bO.c-9210.ts-1324830675.v-24e946e” } {% endhighlight %}
This example gives a much richer picture of information about the error. We now have data like the User-Agent in an easily consumable form, we could much more easily figure out that BadAgent/1.0 is the cause of our 404s. Other information like the source server and a moduniqueid hash can be used to correlate multiple log entries across the lifetime of an request.
This information is also expandable. As the knowledge of what our product needs to log increases, it is easy to add more data, and we can safely do this without breaking our System Admins precious Perl scripts.
Why now?
This idea is not new, it has just never been so easily accessible. Windows has had “Event Logs” for a decade, but in the more recent versions it uses XML. The emergence of JSON as a relatively compact serialization format that can be generated and parsed from almost any programming languages means it makes a great light weight interchange format.
Paralleling the big data explosion, is a growth in machine and infrastructure size. This means logging and the ability to spot errors in a distributed system has become even more valuable.
Logging objects instead of a format string enables you to more easily index and trace operations across hundreds of different machines and different software systems. With traditional format strings it is too fail deadly for the programmer to not log all the necessary information for a later operator to trace an operation.
Generating JSON with Log Magic
Log Magic is a small and fast logging library for Node.js that I wrote early on for our needs at Rackspace. It only has a few features, and it is only about 300 lines of code.
Log Magic has the concept of a local logger instance, which is used by a single module for logging. A logger instance automatically populates information like the the facility in a log entry. Here is an example of creating a logger instance for a module named 'myapp.api.handler and using it:
{% highlight javascript %} var log = require(‘logmagic’).local(‘myapp.api.handler’);
exports.badApiHandler = function(req, res) { log.dbg(“Something is wrong”, {request: req}); res.end(); }; {% endhighlight %}
The second feature that Log Magic provides is what I call a “Log Rewriter”. This enables the programmer to just consistently pass in the request object, and we will take care of picking out the fields we really want to log. In this example, we ensure the logged object always has an accountId and txnId fields set:
{% highlight javascript %} var logmagic = require(‘logmagic’); logmagic.addRewriter(function(modulename, level, msg, extra) { if (extra.request) { if (extra.request.account) { extra.accountId = extra.request.account.getKey(); } else { /* unauthenticated user */ extra.accountId = null; } extra.txnId = extra.request.txnId; delete extra.request; } return extra; }); {% endhighlight %}
The final feature of Log Magic is dynamic routes and sinks. For the purposes of this article, we are mostly interested in the graylog2-stderr, which outputs a GELF JSON format message to stderr:
{% highlight javascript %} var logmagic = require(‘logmagic’); logmagic.route(’root’, logmagic[‘DEBUG’], “graylog2-stderr”); {% endhighlight %}
With this configuration, if we ran that log.dbg example from above, we would get a message like the following:
{% highlight javascript %} { “version”: “1.0”, “host”: “product-api0”, “timestamp”: 1324936418.221, “shortmessage”: “Something is wrong”, “fullmessage”: null, “level”: 7, “facility”: “myapp.api.handler”, ”accountId”: “ac42”, ”txnId”: “.rh-3dT5.h-product-api0.r-pVDF7IRM.c-0.ts-1324936588828.v-062c3d0” } {% endhighlight %}
Other implementations
There are many other libraries that are starting to emerge that can output logs in a JSON or GELF format:
- winston: (Node.js) A more complete (or complex?) logging module compared to Log Magic, but the prolific crew at Nodejitsu have done a great job.
- graypy: (Python) A graylog2 logger that interacts with the standard Python logging module.
- gelf4j (Java) We use a modified version of this library that logs to
stderrinstead of using UDP.
The Transaction Id
One field we added very early on to our system was what we called the “Transaction Id” or txnId for short. In retrospect, we could of picked a better name, but this is essentially a unique identifier that follows a request across all our of services. When a User hits our API we generate a new txnId and attach it to our request object. Any requests to a backend service also include the txnId. This means you can clearly see how a web request is tied to multiple backend service requests, or what frontend request caused a specific Cassandra query.
We also send the txnId to our user’s in our 500 error messages and the X-Response-Id header, so if a user reports an issue, we can quickly see all of the related log entries.
While we treat the txnId as an opaque string, we do encode a few pieces of information into it. By putting the current time and the origin machine into the txnId, even if we can’t figure out what went wrong from searching for the txnId, we have a place to start deeper debugging.
Transporting Logs
Since our product spans multiple data centers, and we don’t trust our LAN networking, our primary goal is that all log entries hit disk on their origin machine first. Some people have been using UDP or HTTP for their first level logging, and I believe this is a mistake. I believe having a disk default that consistently works is critical in a logging system. Once our messages have been logged locally, we stream them to an aggregator which then back hauls the log entries to various collection and aggregation tools.
Since all of our services run under runit, our programs simply log their JSON to stderr, and svlogd takes care of getting the data into a local file. Then we use a custom tool written in Node.js that is like running a tail -F on the log file, sending this data to a local Scribe instance. The Scribe instance is then responsible for transporting the logs to our log analyzing services.
For locally examining the log files generated by svlogd, we also made a tool called gelf-chainsaw. Since JSON strings cannot contain a newline, the log format is easy to parse, you just split up the file by \n, and try to JSON.parse each line. This is useful for our systems engineers when they are on a single machine, trying to debug an issue.
Collecting, Indexing, Searching
Once the logs crossing machines, there are many options to process those logs. Some examples that can all accept JSON as their input format:
- Perl Scripts (Hah! Did you think Perl will ever go away?)
- Graylog2 (open source)
- LogStash (open source)
- Loggly (SaaS)
- Splunk (Proprietary Software, can do JSON with an extra tool)
For Rackspace Cloud Monitoring we are currently using Graylog2 with a patch to support Scribe as a transport written by @wirehead.
Bellow is an example of searching for specific txnId in our system in Graylog2:
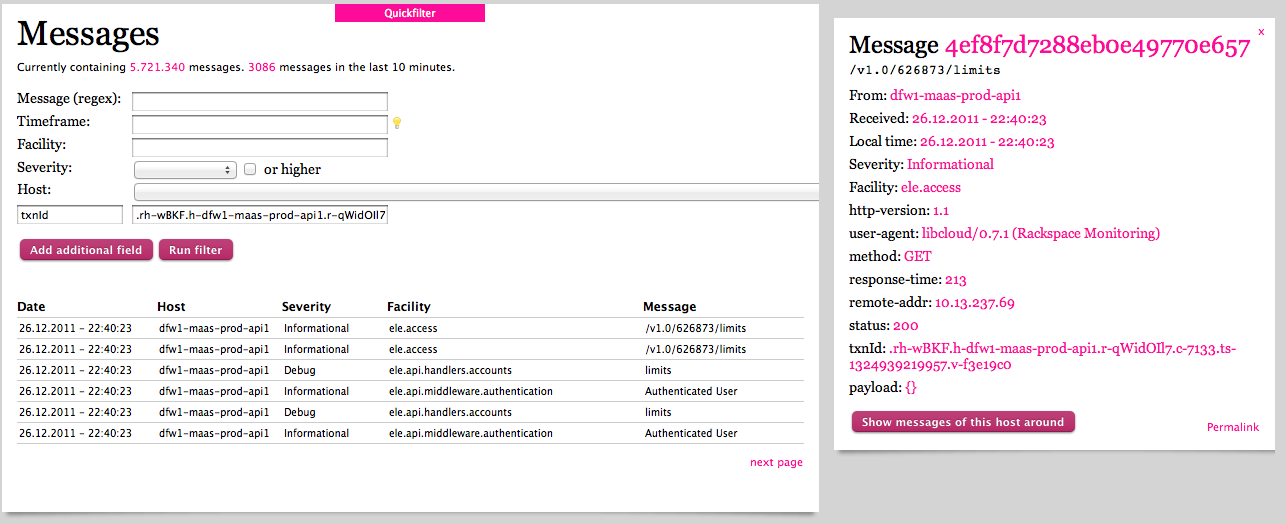
While this example is simple, we have some situations where a single txnId spans multiple services, and the ability to trace all of them transparently is critical in a distributed system.
Conclusion
Write your logs for machines to process. Build tooling around those logs to transform them into something that is consumable by a human. Humans cannot process information in the massive flows that are created by concurrent and distributed systems. This means you should store the data from these systems in a format that enables innovative and creative ways for it to be processed. Right now, the best way to do that is to log in JSON. Stop logging with format strings.
Written by Paul Querna, CTO @ ScaleFT. @pquerna