dsa.Verify
function. The bug is considered a security vulnerability and was assigned the name
CVE-2019-17596. Using CVSS to score the vulnerability, it would likely be classified as a MEDIUM
, because an attack vector for the vulnerability is over the network, without authentication.
The Go language has a good track record from a security point of view. Vulnerabilities have historically been in the developer toolchain (eg, effecting go get
), or logical errors. This vulnerability is different. It is a null pointer dereference causing a panic. Perhaps more importantly is that it could be exploited in many “pre-authentication” contexts. This is because public key cryptographic algorithms like the Digital Signature Algorithm (DSA) are used as an authentication mechanisms. Thankfully, due to the design of the Go language, this vulnerability is limited to crashing the process, and does not appear to be a mechanism to trigger a remote code execution or have a more serious impact.
A few years ago I was discussing network level pre-authentication exploits with Marc Rogers. I made a ridiculous statement about how they just aren’t going to happen that often — and how this is an important component for the vision of Zero Trust architectures. Marc responded with this:
Anything man makes, man can break
And today, Marc is right. DSA is math at its heart, but the implementation is still man made, and was broken. I hope these kinds of vulnerabilities aren’t common, since we need some building blocks to build systems upon, but since this is a more interesting vulnerability, I thought it would be fun to dive into how it works and see if we can build an exploit.
The release announcement email said “Invalid DSA public keys can cause a panic in dsa.Verify”. Sounds simple enough, although the Go project did not provide any examples of what an invalid public key looks like. The next step is to look at the fix, as committed to git in the 1.13 release branch:
w := new(big.Int).ModInverse(s, pub.Q)
+ if w == nil {
+ return false
+ }
The math/big
package deals with very large numbers, and the big.Int
type has a different design pattern than many parts of Go standard library: Many functions in the package return new copies of *big.Int
for an operation, and if that operation has an error, they return nil instead. The big.Int.ModInverse
function is documented as doing this. If we look further along in the the dsa.Verify
function, we can see w is used without checking if ModInverse
failed. The commit to fix the bug is a simple guard, checking the return value of ModInverse
, and failing verification if it failed.
Since the release announcement mentioned invalid public keys could cause the panic, it seems clear we just need to make a pub.Q
that causes the ModInverse function to return nil
. The ModInverse documents its failure conditions:
// ModInverse sets z to the multiplicative inverse of g in the ring ℤ/nℤ
// and returns z. If g and n are not relatively prime, g has no multiplicative
// inverse in the ring ℤ/nℤ. In this case, z is unchanged and the return value
// is nil.
I didn’t take time to really comprehend what the documentation was explaining, instead thinking I needed to construct a seemingly valid pub.Q, but slightly invalid somehow. I dove headfirst in with an ignorant fuzzing phase. I started with a pub.Q from a valid DSA key parameters, and thought I could increment it by one until ModInverse failed. I made a small test case, let my laptop run for a minute trying higher values, but it did not work.
I paused and took time to read the code, to understand what ModInverse
is doing. The critical error condition path is this:
d.GCD(&x, nil, g, n)
// if and only if d==1, g and n are relatively prime
if d.Cmp(intOne) != 0 {
return nil
}
We just need the Greatest Common Denominator (GCD) of the two numbers to not be the integer 1.
The other piece of information I realized at this point, was that the r parameter in the dsa.Verify
function is from the DSA SIgnature. In most cases if you are an attacker, you could be in a position to provide both the public key and the signature to verify. After staring at very large numbers like 1289233352290115814210005730521570412018870172097
for awhile, I decided to use the smallest numbers possible that could cause a GCD of more than one.
When you reduce the problem down to this, you could use the number two (2) for r
, and four (4) for pub.Q
, since the greatest common denominator of these numbers is 2, the condition returns nil:
r := new(big.Int).SetInt64(2)
q := new(big.Int).SetInt64(4)
d := new(big.Int).GCD(nil, nil, r, q)
Now that we have numbers that cause ModInverse
to return nil, we need to construct a test case that can cause dsa.Verify
to crash. But when I tried our numbers out, I saw that dsa.Verify
returned false instead of crashing. Going back to the unpatched function, we see this:
if r.Sign() < 1 || r.Cmp(pub.Q) >= 0 {
return false
}
if s.Sign() < 1 || s.Cmp(pub.Q) >= 0 {
return false
}
w := new(big.Int).ModInverse(s, pub.Q)
n := pub.Q.BitLen()
if n&7 != 0 {
return false
}
src/crypto/dsa/dsa.go#L274-L286
There are 3 conditionals we must pass before crashing, in addition ModInverse
returning nil
. The first two conditions are simple enough, we cannot use a negative r or s, and the pub.Q must be greater than r and s. Our choices of 2 and 4 work fine. The last conditional is a little different. It’s checking how many bits it would take to represent pub.Q in binary. With a value of 4, the BitLen()
is only 3. The minimal value with a BitLen()
that is greater than 7 is 128.
Setting s=2
, r=2
, pub.Q=128
we are able to crash dsa.Verify
:
r.SetInt64(2)
s.SetInt64(2)
priv.PublicKey.Q.SetInt64(128)
dsa.Verify(&priv.PublicKey, hashed, r, s))
Making a local test case that crashes is trivial even if there isn’t a security vulnerability, what makes this crash interesting is if we can trigger it over a network protocol. Many protocols can use DSA to verify the identity of the other peer. I wanted to demonstrate the vulnerability in a protocol that many people used, but in a proof of concept that is not directly weaponizable. Breaking SSH Clients seemed like a good target, since it would require a man in the middle connection for most attackers, and is just a client crash worst case. I’m going to leave exploiting this vulnerability TLS Client Certificates as an exercise for the reader…
In the SSH-2 protocol, there is a Key Exchange phase. One of the messages from the Server to the Client signed with its “host key”, and as part of the protocol, the client must run the dsa.Verify
function on this signed data. For this exploit, all we need to do is inject our bad values for r, s, and pub.Q into the SSH Key exchange.
The gliderlabs/ssh package makes it easy to construct a mock SSH server, so then we can try to crash an SSH client. On the server, the first step is to construct a crypto.Signer which returns our evil values:
priv.PublicKey.Q.SetInt64(128)
fs := &fakeSigner{
R: new(big.Int).SetInt64(2),
S: new(big.Int).SetInt64(2),
public: priv.PublicKey,
}
The crypto/ssh
package uses a different interface for its Signers
, but there is a helper function to convert a crypto.Signer into the interface the ssh package needs: ssh.NewSignerFromSigner
. To the mock SSH server, we add the evil signer as a host key.
On the client, we just call ssh.Dial with a default configuration:
conn, err := gossh.Dial("tcp", addr, clientConfig)
require.NoError(t, err)
defer conn.Close()
Running this with Go 1.13.1, we get a crash:
panic: runtime error: invalid memory address or nil pointer dereference
[signal SIGSEGV: segmentation violation code=0x1 addr=0x18 pc=0x536c9c]
goroutine 6 [running]:
math/big.(*Int).Mul(0xc000043bb8, 0xc000043bd8, 0x0, 0xc000016460)
math/big/int.go:168 +0xdc
crypto/dsa.Verify(0xc00000e460, 0xc000016460, 0x14, 0x20, 0xc000043cc0, 0xc000043ca0, 0xc000120280)
crypto/dsa/dsa.go:289 +0x214
golang.org/x/crypto/ssh.(*dsaPublicKey).Verify(0xc00000e460, 0xc000016440, 0x20, 0x20, 0xc00011a2a0, 0x0, 0x0)
golang.org/x/crypto@v0.0.0-20191011191535-87dc89f01550/ssh/keys.go:474 +0x367
golang.org/x/crypto/ssh.verifyHostKeySignature(0x807f00, 0xc00000e460, 0xc00011e580, 0x807f00, 0xc00000e460)
golang.org/x/crypto@v0.0.0-20191011191535-87dc89f01550/ssh/client.go:124 +0xd9
Another interesting part of this crash, is because of how the SSH Client library is using goroutines for processing, it is not possible to use the recover()
function to return from the crash. The ssh.Dial
creates a goroutine for the connection, and when this verify fails, its in a new goroutine without a recover function, meaning the Go runtime has no choice but to exit the process. This design and use of goroutines in the ssh.Client
is not a good pattern, since callers to Dial are unable to recover from errors. In issue #34960, it describes that the effect on net/http.Server
is limited because it internally recover()
the panic in its connection handling goroutine.
Test cases using a Docker container that has an old and vulnerable version of Go are on github at pquerna/poc-dsa-verify-CVE-2019-17596
This type of vulnerability is a good example of one that could be identified using static analysis or fuzzing. Daniel Mandragona and regilero were credited with discovering and reporting the issue, but I have not seen any mention of how they found the bug. Even with static analysis, it would take some work to fully understand if the error conditions could actually be exploited, which leads to many static analysis issues being ignored.
Finally, as a general statement, DSA itself should not be used anymore. The only reason to enable it is to support a legacy system. OpenSSH for example removed support for DSA in recent releases. This class of vulnerability isn’t isolated to DSA, but every code path has potential vulnerabilities — so if you can disable DSA completely in your systems, you should.
]]>I want to address some of the negativity about the acquisition. Parts of the open source community are worried that Microsoft is going to ruin Github. I think these concerns are misplaced at a tactics and strategy level. However, at a mission level, I think it is important to compare Github to an open source foundation like the Apache Software Foundation1.
I’ve been a long term user of Github and an advocate for using it for many years. I’m also a member of the Apache Software Foundation. These are two of the juggernauts of the modern open source movement. They both are trying to encourage contributions to existing projects, they are both trying to get communities to live and grow on their platforms.
I think parts of the community is missing something important: The ASF and Github are alike in so many ways, but they have massively different missions.
Github was a venture backed, for-profit corporation. Github has used tactics and strategy to create returns is based on growing open source communities. This means as an open source community, you had a short term synergistic relationship with Github. The Github product helped your community grow and be productive. This is great. Github also had other strategies that leveraged it’s open source popularity to create business services and an enterprise on-premise product.
Github’s mission, as a for-profit corporation, is to generate a financial return. VC backing, which also mandates the generation of a return, only reinforces this mission.
Apache is a non-profit 501(c)(3) foundation. Its tactics and strategy are to provide services and support for open source communities. Seemingly, not that different from a community point of view in the short term.
Apache’s mission however, is to provide software for the public good. It’s literally the first line on the ASF About Page.
A mission is important. When people in a place change, so will the tactics and strategy.
In 100 years, I hope the ASF is still a relevant way to provide software for the public good. I think there is a decent chance of this.
In 100 years, I don’t know if even the Microsoft brand will exist, let alone Github.
Github was never a replacement for the ASF, and at the same time, the ASF should learn from it. Github massively widened who contributes to open source. They made contributions easier. They innovated on what open source even means. They built an amazing product that I use every day.
The communities I’m part of, I believe will outlive Github. Communities can benefit from these for-profit endeavors. Synergy between their needs and the tactics of a for-profit company are good for the community. But as a community we must understand that we are part of the product, There is a benefit to the company for helping.
Github’s strategy including building an amazing product, but don’t confuse the missions.
[1]: I used the ASF as the primary example in this post, but you can swap ASF for Node Foundation, Linux Foundation, Free Software Foundation, etc. They all have broadly similar missions around producing software and supporting communities.
]]>In the last 6 and half years, I’ve seen so much: From a rag tag startup, to being acquired, to building products at a publicly traded company. I was also lucky enough to encounter my wife Kristy through this process. I have no regrets about it. This was one of those good runs, a run of time through which I met many interesting people who will forever shape my life.
But the time has come: To branch out, to explore, to define something as my own — and that is why I’m excited, to create, to push, to learn, to be a founder.
I find it amusing that Cloudkick’s original mission was to make Sysadmin’s lives better: Cloudkick started, with the basics, like visualizing your servers and monitoring. Cloudkick was acquired before we got much further. I look at CoreOS as a continuation, iterating on what it means to be an operating systems. ScaleFT has the same basic domain, with this tilt: How can we iterate on how a team of humans operates a software system.
For example, I see often actions taken in production are reported via an email after the fact — “Hey I just change X on the load balancer” in an email to the team. This is a common experience for operations teams. I think we can do better. I think we can make the actions a person takes in production reflected in many places, instantly, accurately, and in a way that augments teams to the achieve their fullest potential.
I’ve personally lived in the space between operations and software development. I want to make this a better world, an efficient world, a safe world — so that is why I’m creating ScaleFT — to push the boundaries, to create a company dedicated to this, to iterating on what production operations itself means.
]]>There was no master plan from 5 years ago to build OnMetal. A handful of advocates within Rackspace pushed to create the OnMetal product, because of our joint experiences in building and using infrastructure.
When Rackspace acquired Cloudkick 3.5 years ago we were running hundreds of cloud instances — we were spending huge amounts of engineering effort working around their flaws and unpredictability. The technical challenge was fun. We got to know the internals of Apache Cassandra really well. We would spend weeks rewriting systems, an eternity in startup-time, just because a cloud server with 8 gigabytes of RAM was falling over.
Once acquired, we escaped virtualization and entered the supposed nirvana of designing custom servers. We customized servers with an extra 32 gigabytes of RAM or a different hard disk model. Because of our different generations of data centers, we had to vary cabinet density based on power and cooling. We also had to build capacity models for our network switches and pick different models, but why was I doing this? I just want to build products. I do not to want worry about when we should be buying a larger piece of network equipment. I also definitely do not care how many kilowatts per cabinet I can put into one data-center but not the other.
By the summer of 2013 I was looking for a new project. I had spent the last 12 months as part of the Corporate Development team working mostly on partnerships and acquisitions. My role involved bringing technical expertise to bear on external products and judging how they could match our internal priorities. It was a fun experience and I enjoyed meeting startup founders and learning more about business, but I wanted to make products again.
Ev, one of the Mailgun founders, had recently moved to San Antonio and was also looking for a new project. Ev and I both wanted to build an exciting and impactful product. We had both experienced building infrastructure products on top of virtualized clouds and colocation. We saw opportunities for improvement of multi-tenancy in a public cloud, and at the same time we could attack the complexities found with colocation. After a couple brainstorming sessions, we agreed about the basics of the idea: Deliver workload optimized servers without a hypervisor via an API. We called this project “Teeth”. Teeth is an aggressive word; we wanted our cloud to project a more aggressive point of view to the world. We also knew that the code name of Teeth was so ridiculous that no one from marketing would let us use it as the final name.
The Teeth team logo. @fredland sketched it on our team whiteboard, we adopted it.
The Teeth project started as part of our Corporate Strategy group — a miniature startup — outside of our regular product development organization. This removed most of the organizational reporting and structure, and gave our day to day a more startup-like feeling. This let us get prototypes going very quickly, but definitely had trade-offs in other areas. We found that while we were building a control plane for servers, integration with other teams like Supply Chain or Datacenter operations was critical — but because we were not in the normal product organization we had to use new processes to work with these teams.
As we kicked off Teeth, it was just a team of two: Ev and myself. We had gotten signoff at the highest levels, but we were still just two people in a 5,500 person company. Getting hardware in a datacenter is easy at Rackspace, but it was clear for our first hardware the project needed a more lab-like environment. I wanted to be able to crash a server’s baseboard management card (BMC) and not have to file a ticket for someone physically power cycle the server. I was working out of the Rackspace San Francisco office, and unlike our headquarters we didn’t have a real hardware lab with extra hardware lying around.
We put in a request for hardware through our standard channels. We were told a timeline measured in weeks. We waited a few weeks, but the priority of our order was put behind other projects. This was a legitimate reaction from internal groups, they had much larger projects on tighter timelines, more important than two engineers wanting to fool around in a lab. After conferring with Ev, we did what any reasonable startup would do: I went on to Newegg.com and bought 3 servers to be our first test kit. My only requirement for the servers is that they had working BMCs with IPMI, so I ordered 3 of the cheapest SuperMicro servers on Newegg. They arrived in the office 48 hours later.
Rackspace knew it does not create value from proprietary server designs, we create value from reducing the complexity of computing for our customers. However, before Teeth, we had tinkered, but hadn’t yet deployed a large scale system using OCP servers.
Rackspace has supported the Open Compute Project (OCP) from the beginning of the project. Our team is mostly software-people, and we love open source. We knew it was risky and could take longer to build Teeth on top of OCP, but we believed fundamentally that OCP is how servers should be built.
Once we picked the OCP platform, we received OCP servers into our lab environment and we iterated on the BIOS and Firmwares with our vendors. We required specific security enhancements and changes to how the BMC behaved for Teeth.
Using OCP has been a great experience. We were able to achieve a high density, acquire specific hardware configurations, customize firmwares and still have a low cost per server. As the OnMetal product continues to mature, I want our team to push back our learnings to the OCP community, especially around the BIOS, Firmware, and BMCs.
OpenStack Nova has had a baremetal driver since the Grizzly release, but the project has always documented the driver as experimental. It remained experimental because it had only a few developers and many bugs. The Nova community also realized that a baremetal driver had a scope much larger than all of its other drivers. It had to manage physical hardware, BMCs, top of rack switches, and use many low level protocols to do this. This realization by the community led to OpenStack Ironic being created as a standalone baremetal management project. The goal is to have a small driver in Nova, and the majority of the complexities can be handled in Ironic.
When the team started building our Teeth prototype, OpenStack Ironic did not seem finished and we weren’t sure how quickly it would progress. Researching the project we found that the default PXE deployment driver was the main focus of development.
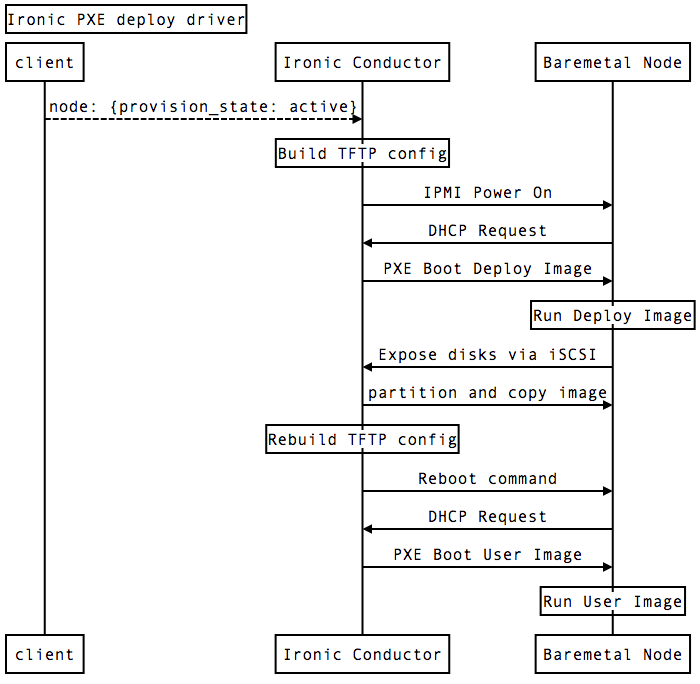
The Ironic PXE deployment method works by running a TFTP server on each Ironic Conductor, and as the node boots serving out a custom configuration for each baremetal node. Once the baremetal node is booted into the Deployment image, the deployment image exports local disks via iSCSI back to the Ironic Conductor. The Ironic Conductor can then write out the requested image using dd. Once this is complete the TFTP configuration is rewritten to reference the User image, and then the Baremetal node is rebooted.
As we researched the existing Ironic PXE deployment method we were unhappy for these reasons:
Because of these reasons we started the Teeth prototype outside of OpenStack Ironic. We still wanted Nova integration, so we built our prototype as a Nova driver, and separate control plane, conceptually similar to Ironic’s architecture.
By early 2014 we saw that the control plane we were building mirrored Ironic closely. We were solving the same problem, and we wanted our users to use the same Nova public API. Looking at what we had built and looking at Ironic again, we saw we only needed to change how Ironic deployments themselves worked. We decided to attend the Ironic mid-cycle meetup in February 2014. At the meetup our team explained how our Teeth prototype used an “Agent” based model, where a long-running Agent running in a RAM disk can take commands from the control plane. This Agent based approach eventually was renamed Ironic Python Agent (IPA, yes, the team was excited to name their software after beer).
The Ironic Python Agent presents an HTTP API that the Ironic Conductor can interact with. For IPA, we decided early to build upon two architectural pillars:
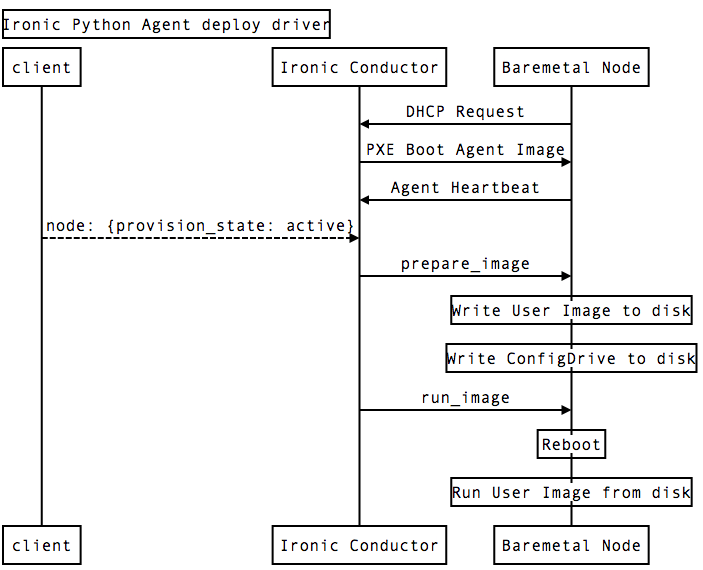
With IPA the DHCP, PXE and TFTP configurations become the static for all baremetal nodes, reducing complexity. Once running, the Agent sends a heartbeat to the Ironic Conductors with hardware information. Then the Conductors can order the Agent to take different actions. For example in the case of provisioning an instance, the Conductor sends an HTTP POST to prepare_image with the URL for an Image, and the Agent downloads and writes it to disk itself, keeping the Ironic Conductor out of the data plane for an image download. Once the image is written to disk, the Ironic Conductor simply reboots the baremetal node, and it boots from disk, removing a runtime dependency on a DHCP or TFTP server.
After the successful mid-cycle meetup and the welcoming attitude we saw, we decided to become an active participant with the community. We abandoned our proprietary prototype, and have been contributing to the Ironic Python Agent deployment method and the Ironic control plane inside the OpenStack community.
As our small team progressed in developing Teeth, we began to see a need to integrate into existing Rackspace products and organizational processes. For example we wanted the OnMetal flavors to show up in the standard Nova API, along all of our other flavors. To implement this we needed our Ironic system to be integrated with Nova. We did this by creating a new Nova cell just for the OnMetal flavor types. The top level cell only needs basic information about our instances, and then the nova-compute instances in our cell load the Ironic virt driver where all the hard work happens.
As we integrated software systems, our startup behaviors and structures were less valuable. We needed to reduce confusion and tension with the rest of the company. Once we moved to an integration mode, we moved the engineering team back into our normal product development organization. The teams quickly started working together closely and we hit our execution targets. In some ways it was like a mini-startup being acquired and quickly integrating into a larger company.
We wanted to announce Teeth to the public this summer. We considered the OpenStack Summit in Atlanta — we believe the combination of OpenStack software with Open Compute hardware is a great message for the community. But instead of announcing a product, we preferred to focus our discussion with the community at the OpenStack Summit on the Rebel Alliance vision.
The Structure Conference presented a great opportunity to show our message. Our message is that platforms should be open. That offerings should be specialized for their workloads. That using Containers and OnMetal are another way we can reduce complexity from running large applications. That we are not stuck on a virtualization only path. That our customers find value from reducing complexity and having a best fit infrastructure.
After working on the Teeth project it felt great to see our message has been well received by both the press and Twitter commentary. Interest in the OnMetal product offering has been overwhelming, and now our team is focusing on fixing as many bugs as possible, onlining more cabinets of OCP servers for capacity, and preparing for the general availability phase of the product.
Thanks to Alexander Haislip, Robert Chiniquy and Chris Behrens for reviewing drafts of this post.
]]>My secret project has been announced: Rackspace OnMetal Cloud Servers.
OnMetal is bare metal servers via the OpenStack Nova API. These servers contain no hypervisor or other abstraction when your operating is running on them — they are bare metal, and available over an API. They have utility billing and other attributes of cloud servers, but are single tenant up to the top of rack switch. The underlying product is built on top of OpenStack Ironic and Open Compute Servers.
I have spent the last decade building software deployed into combinations of colocation and cloud infrastructures. They all sucked in their own special ways. This product is about taking the dynamic advantages of cloud and combining it with the performance and economics of colocation.
Each instance is specialized for a specific task:
Instance Type | CPU | RAM | IO |
---|---|---|---|
OnMetal IO v1 | 2x 2.8Ghz 10 core E5-2680v2 Xeon | 128GB | 2x LSI Nytro WarpDrive BLP4-1600(1.6TB) and Boot device (32G SATADOM). |
OnMetal Memory v1 | 2x 2.6Ghz 6 core E5-2630v2 Xeon | 512GB | Boot device only. (32G SATADOM) |
OnMetal Compute v1 | 1x 2.8Ghz 10 core E5-2680v2 Xeon | 32GB | Boot device only. (32G SATADOM) |
While I am a believer in the eventual winning of Mesos-like scheduling systems, the reality of today is that developers want extreme mixes of server profiles. OnMetal provides this with an IO instance with 3.2TB of Flash Storage, a Memory instance with 512GB of RAM, and an economical compute instance with 10 fast cores and lots of network.
Additionally each instance has dual 10 gigabit network connections in a high availability MLAG.
OnMetal is currently in an “early access” program. General Availability is expected by the end of July 2014.
The instances are just another flavor type in the Rackspace Public Cloud API — you just pass in onmetal-io-v1
instead of performance2-120
as the flavor type, and it shows up, just like a virtualized cloud server would.
We are not releasing pricing yet. Soon™.
]]>One trick I’ve recently figured out is using sed
with a ProxyCommand
— this lets me optionally use a bastion host by just appending .bast
to a hostname. Most examples of using ProxyCommand
apply it to all hosts, or a specific sub-domain, but this configuration allows you to late decide if you want to use the bastion or not.
Examples:
# uses bastion:
ssh myserver.example.com.bast
# goes directly to myserver:
ssh myserver.example.com
Place the following in your .ssh/config
, with the appropriate changes for your environment:
Host bastion
Hostname bastion-server.example.com
ProxyCommand none
User paul.examplesurname
ControlMaster auto
ControlPath ~/.ssh/master-%r@%h:%p
Host *.bast
ProxyCommand ssh -aY bastion 'nc -w 900 `echo %h | sed s/\\.bast$//` %p'
ForwardAgent yes
TCPKeepAlive yes
ServerAliveInterval 300
Any hostname that ends in .bast
will now use the bastion as its proxy, but on the bastion it will resolve the DNS without the .bast
in the hostname. Additionally because the bastion host has SSH Multiplexing configured, after the first connection to the bastion, all others are very quick to become established.
I am only describing the on site interview structure in this post, and not all aspects of the hiring process.
Note: We are always iterating on our interviews. We also do not have top down approach for the whole company. If you interview at other Rackspace locations or in the future, don’t fret if the process is different.
In a few hours interviews are attempting to ascertain a candidate’s aptitude, fit, knowledge, potential and more. This is difficult. Human interactions are hard to measure, and the pressure of an interview does not lend itself to consistent results. In our interviews we try to achieve the following goals:
The day before an on-site interview we schedule a 15-30 minute meeting with all of our interviewers. The hiring manager drives the meeting and supplies the interviewers with an interview guide that changes for each position. Here is a recent example of an interview guide used by Mailgun (PDF) The objective is to outline in writing the position we are hiring for, how they will fit into the team, and what each interview panel is trying to achieve. The Prehuddle gives time for interviewers to ask questions to the hiring manager so that they can come prepared to their interview panels. It also gives interviewers time to coordinate on who is covering each topic. We want to avoid situations where one interview panels assume another panel will ask certain questions.
On the day of the interview we begin by giving the candidate a short tour of the office, ending in the conference room that will be used for the interview. On a white board in the conference room we have the schedule for the rest of the day written up. We try to keep the candidate in the same conference room for the whole day, to avoid losing 10 minutes of every panel to moving or finding the candidate.
An example schedule for a Software Development position:
The interview consists of 4-5 panels of 2 interviewers. Each panel is generally 1 hour long. We consider it a best practice to also schedule an informal lunch with 2 more Rackers in-between the panels, but depending on the times of the panels this doesn’t always happen. After the panel interviews, we want the hiring manager have few final words with the candidate and to escort the candidate out of the office.
When selecting interviewers for a panel, we consider the following:
We try to schedule a feedback session immediately after the candidate has left. Waiting until the next day will dull memories. We assemble all of the interviewers, and the hiring manager drives the meeting. We have the interviewers recall their interview in reverse seniority, with the hiring manager going last. Each interviewer has the floor for 2-3 minutes. Clarifying questions can be asked by other interviewers. After all of the other interviewers, the hiring manger shares their thoughts and the hiring manager then asks for any final conversation. Once this is done, we conduct an anonymous vote:
If the total is positive the hiring manager has the option to continue with the candidate. The hiring manager may still do other things like referral checking. If the total is zero or negative we will not hire the candidate.
Here are some ideas I have been thinking about for continuing to iterate on our interviews:
ffjson
works by generating static code for Go’s JSON serialization interfaces. Fast binary serialization frameworks like Cap’n Proto or Protobufs also use this approach of generating code. Because ffjson
is serializing to JSON, it will never be as fast as some of these other tools, but it can beat the builtin encoding/json easily.
The first example benchmark is Log structure that CloudFlare uses. CloudFlare open sourced these benchmarks under the cloudflare/goser repository, which benchmarks several different serialization frameworks.
Under this benchmark ffjson
is 1.91x faster than encoding/json
.
go.stripe contains a complicated structure for its Customer object which contains many sub-structures.
For this benchmark ffjson
is 2.11x faster than encoding/json
.
If you have a Go source file named myfile.go
, and your $GOPATH
environment variable is set to a reasonable value, trying out ffjson
is easy:
go get -u github.com/pquerna/ffjson
ffjson myfile.go
ffjson
will generate a myfile_ffjson.go
file which contains implementations of MarshalJSON
for any structures found in myfile.go
.
At the last GoSF meetup, Albert Strasheim from CloudFlare gave a presentation on Serialization in Go. The presentation was great — it showed how efficient binary serialization can be in Go. But what made me unhappy was how slow JSON was:
All of the competing serialization tools generate static code to handle data. On the other hand, Go’s encoding/json
uses runtime reflection to iterate members of a struct
and detect their types. The binary serializers generate static code for the exact type of each field, which is much faster. In CPU profiling of encoding/json
it is easy to see significant time is spent in reflection.
The reflection based approach taken by encoding/json
is great for fast development iteration. However, I often find myself building programs that serializing millions of objects with the same structure type. For these kinds of cases, taking a trade off for a more brittle code generation approach is worth the 2x or more speedup. The downside is when using a code generation based serializer, if your structure changes, you need to regenerate the code.
Last week we had a hack day at work, and I decided to take a stab at making my own code generator for JSON serialization. I am not the first person to look into this approach for Go. Ben Johnson created megajson several months ago, but it has limited type support and doesn’t implement the existing MarshalJSON
interface.
Go has an interface defined by encoding/json
, which if a type implements, it will be used to serialize the type to JSON:
type Marshaler interface {
MarshalJSON() ([]byte, error)
}
type Unmarshaler interface {
UnmarshalJSON([]byte) error
}
As a goal for ffjson
I wanted users to get improved performance without having to change any other parts of their code. The easiest way to do this is by adding a MarshalJSON
method to a structure, and then encoding/json
would be able find it via reflection.
The simplest example of implementing Marshaler
would be something like the following, given a type Foo
with a single member:
type Foo struct {
Bar string
}
You could have a MarshalJSON
like the following:
func (f *Foo) MarshalJSON() ([]byte, error) {
return []byte(`{"Bar":` + f.Bar + `}`), nil
}
This example has many potential bugs, like .Bar
not being escaped properly, but it would automatically be used by encoding/json
, and avoids many reflection calls.
During our hack day I started by using the go/ast module as a way to extract information about structures. This allowed rapid progress, and at my demo for the hack day I had a working prototype. This version was about 25% faster than encoding/json
. However, I quickly found that the AST interface was too limiting. For example, a type is just represented as a simple string in the AST module. Determining if that type implements a specific interface is not easily possible. Because types are just strings to the AST module, complex types like map[string]CustomerType
were up to me to parse by hand.
The day after the hack day I was frustrated with the situation. I started thinking about alternatives. Runtime reflection has many advantages. One of the most important is how easily you can tell what a type implements, and make code generation decisions based on it. In other languages you can do code generation at runtime, and then load that code into a virtual machine. Because Go is statically compiled, this isn’t possible. In C++ you could use templates for many of these types of problems too, but Go doesn’t have an equivalent. I needed a way to do runtime reflection, but at compile time.
Then I had an idea. Inception: Generate code to generate more code.
I wanted to keep the simple user experience of just invoking ffjson
, and still generate static code, but somehow use reflection to generate that code. After much rambling in IRC, I conjoured up this workflow:
ffjson
ffjson
parses input file using go/ast
. This decodes the package name and structures in the file.ffjson
generates a temporary inception.go
file which imports the package and structures previously parsed.ffjson
executes go run
with the temporary inception.go
file.inception.go
uses runtime reflection to decode the users structures.inception.go
generates the final static code for the structures.The inception approach worked well. The more powerful reflect
module allowed deep introspection of types, and it was much easier to add support for things like Maps, Arrays and Slices.
After figuring out the inception approach, I spent some time looking for quick performance gains with the profiler.
I observed poor performance on JSON structs that contained other structures. I found this to be because of the interface of MarshalJSON
returns a []byte
, which the caller would generally append to their own bytes.Buffer
. I created a new interface that allows structures to append to a bytes.Buffer
, avoiding many temporary allocations:
type MarshalerBuf interface {
MarshalJSONBuf(buf *bytes.Buffer) error
}
This landed in PR#3, and increased performance by 18% for the goser
structure. ffjson
will use this interface on structures if it is available, if not it can still fall back to the standard interface.
When converting a integer into a string, the strconv
module has functions like AppendInt. These functions require a temporary []byte
or a string allocation. By creating a FormatBits
function that can convert integers and append them directly into a *bytes.Buffer
, these allocations can be reduced or removed.
This landed in PR#5, and gave a 21% performance improvement for the goser
structure.
I welcome feedback from the community about what they would like to see in ffjson
. What exists now is usable, but I know there are few more key items to make ffjson
great:
ffjson
doesn’t currently handle embedded structures perfectly. I have a plan to fix it, I just need some time to implement it.ffjson
to highlight any performance problems with real world structures as much as possible. If you have any other ideas, I am happy to discuss them on the Github project page for ffjson
]]>I see a class of data are not well covered by existing standards. I call them “Infrastructure Secrets”. Infrastructure Secrets are credentials or secrets that are commonly used to build or deploy applications and that they are often shared with third party services. Examples include:
Many times systems using these secrets are running without direct human supervision, and the credentials they use are not locked down to single use cases. Many of these infrastructure providers do not have RBAC or limited use tokens. Even if the provider has an excellent system for limiting the scope of a credential, properly locked down tokens are still rarely used.
More than 4 years ago at Cloudkick we were dealing with these Infrastructure Secrets, including AWS API Keys and SSH keys to customer servers. I believe we took a paranoid approach to these securing these secrets. Cloudkick used all of the techniques that I outline bellow, and more.
MongoHQ is a startup providing MongoDB as a service. Last week they were hacked, based on a compromised password. CircleCI is another startup providing continuous integration and deployment. They happened to be using MongoHQ as their database provider. CircleCI stored many Infrastructure Secrets given to them by their customers. The diagram bellow outlines the steps in the attack:
This attack is a great example of privilege escalation across multiple providers and systems. Starting from just a compromised email password, the attacker escalated to SSH Keys, EC2 IAM credentials and more.
An in-depth threat model is application specific, but I want to outline some common threats that I see across many companies interacting with Infrastructure Secrets.
Individuals pick good passwords, but people pick bad ones. This is not going to change.
Support tools are critical components of a SaaS business, and most are built to allow an employee to do anything a customer can do — sometimes even with a direct impersonation feature so that the support team can see exactly what a customer would see. They tend to have poor security precautions or logging, and at the same time time access to every customer’s information.
Databases are backed up, they are left on employee hard disks, and in the case of CircleCI, even hosted with 3rd-parties. Newer NoSQL data stores tend to have simple access controls, and often companies use a single set of credentials for all access.
Applications are being developed as quickly as possible using a relatively small set of server technologies. For example in January, there was an exploit against Ruby on Rails that allowed remote code execution. If an attacker were to uncover similar exploits in the future, attacking someone who stores infrastructure secrets could be much more lucrative that other targets.
Defense in depth is a common approach to information security. I view security as a series of white picket fences. Jumping over a single fence might be easy, but jumping over 40 isn’t. If a system is partially compromised, having side effects that alert you to abnormal behaviors is also important.
Don’t type the words AES
, use Keyczar. Keyczar is a series of libraries built to have a simple API and sane defaults. The best cryptography algorithm will always change, but Keyczar provides file formats and mechanisms for changing these defaults over the life time of an application. To support data of various lengths the Keyczar Sessions API should generally be used. At Cloudkick we used Django and developed a KeyczarField
that overrode models.TextField
serialization to the database. We could then set the fields as if it was a normal ORM field in Django. If a backend service wanted to use the secrets, they had to explicitly decrypt them.
If you use the Keyczar Sessions API you can put the public keys on all servers, but only put the private keys on specific backend servers. This can let a user update a credential from your web server, but only a specific backend service can view the decrypted value.
These backend servers should be on isolated networks and only provide exact operations over their communication channel.
For example, if you are storing SSH Keys to deploy code:
run_command(host, command)
.deploy_project_to_host(host, project)
In the event of a web server being compromised the attacker can only force more deploys to happen — this still might be bad, but it is one more white picket fence for them to jump over.
For Cloudkick, in addition to our normal logging when an employee activated impersonation, we would send an additional email to our root@ alias. The alias got a few emails every day, but an attacker abusing it would of been quickly noticed.
Multi-Factor authentication is a critical and cheap method to protect against the most common threat: bad passwords. For Cloudkick we used YubiKeys extensively. You don’t need an expensive RSA SecureID system, today there are many more options including standards compliant HOTP/TOTP or startups like Duo Security.
The ideas I outlined above are a random collection. Everything from Firewalls, Log collection, patching, secure software designs and more are needed. You can’t protect against all possible threats, like the NSA tapping Google shows, but a reasonable set of white picket fences can stop many threats.
OSWAP have created several guides and recommendations for common pitfalls of web applications. But I have not seen any content covering these types of Infrastructure Secrets. I believe a standard for storing, transporting and using Infrastructure Secrets is needed, and would love to see one evolve.
]]>I have been using Docker on and off for months, but recently started to deploy services using it onto the Rackspace Public Cloud. Unfortunately, not everything went smoothly, and this is the story of getting it all working.
I have published updated Ubuntu 12.04 LTS images for Docker under the racker/precise-with-updates repository. Get the images by running docker pull racker/precise-with-updates
. The latest
tag is automatically updated every day with the latest Ubuntu updates and security patches. The Dockerfile
for building this is on racker: docker-ubuntu-with-updates if you want to tweak it for your own uses.
Following the basic Docker instructions to get it running on Ubuntu 12.04, I installed a new kernel, rebooted, and dockerd
was running successfully.
I started building a new Dockerfile
from the ubuntu:12.04
base image. Everything was going OK, but then apt-get upgrade
crashed with:
Illegal instruction
After some prodding, I find Docker issue #1984 — at least I’m not alone in my sorrow.
Digging through the links, you come to LP: eglibc/+bug/956051, a wonderful bug about glibc. glibc made incorrect the assumptions that if the FMA4 instruction set is available, that the Advanced Vector Extensions (AVX) would also be available. In LP: eglibc/+bug/979003 a patch for this bug is pushed to all recent Ubuntu versions, so why did it crash with Docker?
This affects Docker on Rackspace for two reasons:
AMD Opteron(tm) 4332
processor with Xen which has FMA4
instructions but the AVX
instructions do not work.Since the bug has already been fixed upstream, creating an updated Ubuntu image to use as a base seems like the easiest way to fix this. Little did I know that creating an updated image was another rabbit hole.
I naively started by trying to just run apt-get dist-upgrade
from the ubuntu:12.04
base image. It didn’t work at all. Packages tried to mess with upstart
, and something went horribly wrong with /dev/shm
.
After taking a break to propose to my fiancé and vacation in Hawaii, I built up the following Dockerfile:
FROM ubuntu:12.04
I started with the ubuntu:12.04
base image; It is possible to start from scratch using debootstrap
, but it takes much longer to build and doesn’t provide any advantages.
To allow automated installation of new packages, we set the debconf(7) frontend to noninteractive
, which never prompts the user for choices on installation/configuration of packages:
ENV DEBIAN_FRONTEND noninteractive
One of the updated packages is initramfs-tools. In the post-install hooks, it tries to update the initramfs for the machine and even try to run grub
or lilo
. Since we are inside docker we don’t want to do this. Debian bug #594189 contains many more details about these issues, but by setting the INITRD
environment variable we can skip these steps:
ENV INITRD No
ischroot
is a command used by many post install scripts in Debian to determine how to treat the machine. Unfortunately as discussed in in Debian bug #685034 it tends to not work correctly. Inside a Docker container we almost always want ischroot
to return true. Because of this, I made a new ischroot which if the FAKE_CHROOT
environment variable is set, always exits 0:
ENV FAKE_CHROOT 1
RUN mv /usr/bin/ischroot /usr/bin/ischroot.original
ADD src/ischroot /usr/bin/ischroot
Using this replacement ischroot
, it allows updates to the initscripts
package to successfully install without breaking /dev/shm
, which works around LP Bug #974584.
policy-rc.d provides a method of controlling of the init scripts of all packages. By exiting with a 101
, the init scripts for a package will not be ran, since 101
stands for action forbidden by policy
:
ADD src/policy-rc.d /usr/sbin/policy-rc.d
Before installing any packages, I added a new sources.list that has -updates
and -security
repositories enabled and to use mirror.rackspace.com. Rackspace maintains mirror.rackspace.com
as a GeoDNS address to pull from the nearest Rackspace data center, and it is generally much faster than archive.ubuntu.com
.
ADD src/sources.list /etc/apt/sources.list
Normally dpkg
will call fsync after every package is installed, but when building an image we don’t need to worry about individual fsyncs, so we can use the force-unsafe-io
option:
RUN echo 'force-unsafe-io' | tee /etc/dpkg/dpkg.cfg.d/02apt-speedup
Since we want make the image as small as possible, we add a Post-Invoke
hook to dpkg which deletes cached deb
files after installation:
RUN echo 'DPkg::Post-Invoke {"/bin/rm -f /var/cache/apt/archives/*.deb || true";};' | tee /etc/apt/apt.conf.d/no-cache
Finally we run dist-upgrade
:
RUN apt-get update -y && apt-get dist-upgrade -y
After all the upgrades have been applied, we want to clean out a few more cached files:
RUN apt-get clean
RUN rm -rf /var/cache/apt/* && rm -rf /var/lib/apt/lists/mirror.rackspace.com*
These final steps bring the image down to under 90 megabytes, which is smaller than the default ubuntu:12.04
image.
As one last trick, I flatten the image into a single layer by export and importing the image.
Ubuntu’s gets many updates and security patches on a regular basis. Rather than building a one off image, I hooked up Docker to a builder in Jenkins. The latest
tag is rebuilt every day and pushed to the public registry under racker/precise-with-updates.
This means you can use racker/precise-with-updates:latest
in a Dockerfile
, or in your interactive terminals:
docker run -i -t racker/precise-with-updates /bin/bash
Using docker pull
you can bring the images down locally for other operations:
docker pull racker/precise-with-updates
docker images racker/precise-with-updates
I have also published the source for the image on Github, and would welcome any PRs or feedback.
]]>There are about 15-20 TLS extensions in specifications. Many however are rarely used, some of the most common and important extensions are:
The adoption of TLS features and extensions is directly tied to the User Agent. While consumer websites and web browsers are important, I believe there has not been significant enough attention focused to Web Service API User Agents. Consumer browsers are now on much faster upgrade cycles, but many servers are not going to follow the same upgrade curves.
For this reason, I’ve collected samples from 3 different data sources:
If someone out there could sample a popular consumer site (Google? Facebook? Yahoo?) and post the results I would be very interested in seeing them.
It seemed too difficult to modify the existing server software to log all of the information that I wanted, and because in some cases the TLS termination is done in devices like a load balancer, I decided to build a tool to decode the information from a packet capture. All of the extensions I am interested in are sent by the Client in its ClientHello message. This means I didn’t need to do any cryptographic operations to decode it, just parse the TLS packet.
I started by using the excellent dpkt library to dissect my packet captures, but quickly figured out it didn’t actually parse any of the TLS extensions. A little patching later and I had it parsing TLS extensions.
The script I wrote handles the common issues I’ve seen, but still could be improved to do TCP stream re-assembly, but in practice with all the captures I made, the TLS Client Hello messages were in a single TCP packet.
If you want to try collecting and analyzing your own samples:
git clone git://github.com/pquerna/tls-client-hello-stats.git
cd tls-client-hello-stats
# Let tcpdump run for awhile, press ctrl+c to stop capturing.
sudo tcpdump -i eth0 -s 0 -w port443.cap port 443
python parser.py port443.cap
TLS 1.0 is the version advertised by most clients and servers. The version spread for issues
and monitoring
are about what I would expect, but I was surprised to see that svn.apache.org
was still seeing over 23% of its clients reporting SSLv3 as their highest supported version.
While not an extension, deflate
compression has to be advertised by both sides in order to support it. If used, it also imposes increased memory usage requirements on both the client and server, so I was interested in seeing if clients are advertising support for it.
OpenSSL enables the deflate
compression by default, and until recent versions it was difficult to disable. I suspect that most of the monitoring
traffic is using a default OpenSSL client library, and the more sophisticated browser user agents are explicitly disabling it. Since HTTP and SPDY both support compression inside their protocols, enabling deflate at the TLS layer would commonly lead to content being double compressed.
It is interesting that most of the API centric clients send so few extensions. This seems to indicate potentially both the age of the TLS software stack being used, and the complexity of how it is configured by the developer.
I was disappointed to find a massive gap between consumer browsers and API consumers for SNI. This can be traced to common libraries not setting the SNI extension until recently. For example, only Python 3.2 or newer sends the SNI extension, and because ”Python 2 only receives bug fixes”, it will never be back ported for the most commonly deployed versions of the Python language.
Session Tickets seem to have a more reasonable usage by non-browser user agents, but the consumer browsers are again leading adoption.
NPN support has been driven by the adoption of SPDY in Chrome and Firefox, so it isn’t surprising that for monitoring
we see almost no support from clients.
While the Renegotiation Indication extension is sent by a significant number of clients on issues
, its use is extremely low both svn
and monitoring
. This again shows how Browsers are leading the charge in upgrading, but also since the Renegotiation attacks require a man-in-the-middle, it would generally be a lower priority for server-to-server software.
I’ve posted a gist with the raw data for my three samples, if you wanted to look at the information for a more rarely seen extensions.
I think the data I’ve seen so far says a few things:
I think it is great that Browser vendors like Chrome and Firefox are driving the use of newer features and extensions in TLS. It is obvious however that because API clients are commonly built by a more diverse set of developers, and those developers are less specialized in SSL/TLS security issues, that their adoption of the newest extensions is lagging. I hope this could change quickly if HTTP/2.0 and SPDY start driving the need to use NPN, and I hope that this would get developers to upgrade their SSL/TLS stacks.
]]>AAAA
record.Details:
net.inet.ip.portrange.reservedhigh
to 0
, letting non-root users bind to ports bellow 1024. This lets me run my Node.js server without root
, and without needing to figure out dropping privileges later, mostly because I’m being lazy and its my blog.Yahoo has always said they collect patents for defensive purposes only. Then Yahoo’s newest CEO, Scott Thompson, is brought in, and gives choice quotes like this one, just 3 months ago:
“We’ll be back to innovation, we’ll be back to disruptive concepts,” he added. “I wouldn’t be here if I didn’t believe that was possible.”
Suing Facebook with patents is a disruptive concept. Yahoo just broke the patent mutually assured destruction stalemate in the valley. This also signals to all engineers that Yahoo is not interested in building disruptive products, and is instead a sinking ship.
I believe the patent system as it exists today is broken. Software patents have major issues. There are many things I would like to change, but I cannot. I also believe reform of the system as a whole is unlikely. Previously, I have chosen to try to ignore patents as much as possible. The trouble is if you ignore the patents your own company is at significant risk. Other companies don’t have the same moral beliefs about patents, and will use patents against you.
Many companies say they have a defensive only patent policy. But control of companies changes. Policies change and patents are granted for up to 20 years. Most technology companies also provide some sort of cash or other incentive to employees for filing patents of behalf of the company. Just imagine if you were an engineer at Yahoo in 2005. You made a cool new patentable idea, and went down the path of getting it patented. In 2010, you left Yahoo, as most sane people did, and could of even joined Facebook. Then 2 years after you left Yahoo, your patent, which you thought was going to be used for defensive purposes only, is used in an offensive suit against Facebook.
This kind of situation is exactly why I’ve tried to ignore patents for so long.
I think there is a better approach to motivating engineers, besides a bonus for patents.
If during the patent filing process, a company created a binding legal agreement to only use the new patent for defensive or retaliatory purposes, I would personally find this highly motivating. I am sure that the legal definition of “defensive or retaliatory” would take 20 pages of text to define, but I trust that lawyers can figure out the details. This kind of policy would make me feel much better about putting effort into filing patents for a company. If the company later changes control, they could change this policy, but it would only apply to new patents after that change in control.
I am not a lawyer, but what is stopping something like this from happening?
]]>I don’t expect to be reading much email.
I’m still undecided about where/how to post pictures.
]]>It frustrates me when people use ASCII instead of packed bitmaps for things like this (packet transmitted once a second from potentially hundreds or thousands of nodes, that each frontend proxy has to parse into a binary form anyway before using it). Maybe it’s a really small amount of CPU but it’s just one of many things which could easily be more efficient.
This thread on HN continued with dozens of other posts from many authors, with peterwwillis
holding his ground on his original point.
I disagree with the belief that a binary format should have been used and will attempt to show why the chosen network protocol for mod_heartbeat
was both reasonable and correct.
Apache 2.4 was released this week, 6 years after 2.2 was released. Compared to the 2.2 development cycle, where I was the Release Manager, I have not been as active in 2.4. However, one of the few features I did write for 2.4 was the mod_heartbeat
module. mod_heartbeat is a method for distributing server load information via multicast. While I wrote mod_heartbeat 3 years ago, many other Apache HTTP Server developers have added features and bug fixes since then.
The primary use case is for use by the modlbmethodheartbeat module, to direct traffic to the least loaded server in a reverse proxy pool.
The mod_heartbeat
code and design was derived from a project at Joost. After stopping development of our thick client and peer to peer systems, we were moving to a HTTP based distribution of video content. We had a pool of super cheap storage nodes, which liked to die far too often. We built a system to have the storage nodes heartbeat with what content they had available, and a reverse proxy that would send clients to the correct storage server.
This enabled a low operational overhead around configuration of both our storage nodes and of the reverse proxy. Operations would just bring on a new storage node, put content on it, and it would automatically begin serving traffic. If the storage node died, traffic would be directed to other nodes still online.
mod_heartbeat
’s primary goal is: Enable flexible load balancing for reverse proxy servers.
For Joost we had good switches since we were previously setup for high packet rate peer to peer traffic. We also had previously used multicast for other projects. We choose to use a simple UDP multicast heartbeat as our server communication medium.
When designing the content of this heartbeat packet, I was thinking about the following issues:
Given the above considerations in 2007 at Joost, I started sketching out the possible formats for the multicast packet.
I considered using a binary format, but the immediate problem was having extendable fields. This meant we would need more than a few simple bytes. To create an extensible binary format, I started looking at serialization frameworks like Apache Thrift. At this time in 2007 Thrift had only been open sourced a few months, and it really wasn’t a stable project. It also didn’t have a pure C implementation, and instead would have added a C++ dependency to Apache HTTP server, which is unacceptable. Since 2007 the number of binary object formats like BSON, Google Protocol Buffers, Apache Avro, and Msgpack have exploded, but just 4 years ago there really weren’t any good standardized choices or formats for a pure-C project. The only existing choice would be to use ASN.1 DER, which would of implied a large external dependency, in addition to just being too complex. I decided that because of this and the other goals around debug-ability to peruse an ASCII based encoding of the content.
The choices for non-binary formats were:
I made the decision to use query string style parameters as the best compromise for the content of the multicast packet’s content.
In the open source version of mod_heartbeat
, there are two fields that are exposed today:
Adding the version string v=1
, and then encoding the fields above we get something like this:
v=1&ready;=75&busy;=0
If I were to need to implement the same system today, there are a few things I might change, but I don’t think any of them are critical mistakes given the original design constraints:
Binary encodings of information can be both smaller and faster, but sometimes a simple ASCII encoding is sufficient, and should not be overlooked. The decision should consider the real world impact of the choice. In the last few years we have seen the emergence of Thrift or Protocol Buffers which are great for internal systems communication, but are still questionable when considering protocols implemented by many producers and consumers. For products like the Apache HTTP server, we also do not want to be encumbered by large dependencies, which rules out many of these projects. I believe that the choice of ASCII strings, using query string encoded keys and values is an excellent balance for mod_heartbeat
’s needs, and will stand the test of time.
Source is up on github.com/racker/dreadnot.
]]>Finish the hobby project.
Created using Dustin’s git-timecard.
]]>A printf style format string is the de facto method of logging for almost all software written in the last 20 years. This style of logging crosses almost all programing language boundaries. Many libraries build upon this, adding log levels and various transports, but they are still centered around a formated string.
I believe the widespread use of format strings in logging is based on two presumptions:
I believe these presumptions are no longer correct in server side software.
An example is this classic error message inside the Apache HTTP Server. The following code is called any time a client hits a URL that doesn’t exist on the file system:
{% highlight c %} aplogrerror(APLOGMARK, APLOGINFO, 0, r, “File does not exist: %s”, r->filename); {% endhighlight %}
This would generate a log message like the following in your error.log
:
[Mon Dec 26 09:14:46 2011] [info] [client 50.57.61.4] File does not exist: /var/www/no-such-file
This is fine for human consumption, and for decades people have been writing Perl scripts to munge it into fields for a computer to understand too. However, the first time you add a field, for example the HTTP User-Agent
header, it would break most of those perl scripts. This is one example of where building a log format that is optimized for computer consumption starts to make sense.
Another problem is when you are writing these format string log messages, you don’t always know what information people will need to debug the issue. Since you are targeting them for human consumption you try to reduce the information overload, and you make a few guesses, like the path to the file, or the source IP address, but this process is error prone. From my experience in the Apache HTTP server this would mean opening GDB
to trace what is happening. Once you figure out what information is relevant, you modify the log message to improve the output for future users with the relevant information.
If we produced a JSON object which contained the same message, it might look something like this:
{% highlight javascript %} { “timestamp”: 1324830675.076, “status”: “404”, “shortmessage”: “File does not exist: /var/www/no-such-file”, “host”: “ord1.product.api0”, “facility”: “httpd”, “errno”: “ENOENT”, “remotehost”: “50.57.61.4”, “remoteport”: “40100”, “path”: “/var/www/no-such-file”, “uri”: “/no-such-file”, “level”: 4, “headers”: { “user-agent”: “BadAgent/1.0”, “connection”: “close”, “accept”: ”/” }, “method”: “GET”, “uniqueid”: “.rh-g2Tm.h-ord1.product.api0.r-axAIO3bO.c-9210.ts-1324830675.v-24e946e” } {% endhighlight %}
This example gives a much richer picture of information about the error. We now have data like the User-Agent
in an easily consumable form, we could much more easily figure out that BadAgent/1.0
is the cause of our 404s. Other information like the source server and a moduniqueid hash can be used to correlate multiple log entries across the lifetime of an request.
This information is also expandable. As the knowledge of what our product needs to log increases, it is easy to add more data, and we can safely do this without breaking our System Admins precious Perl scripts.
This idea is not new, it has just never been so easily accessible. Windows has had “Event Logs” for a decade, but in the more recent versions it uses XML. The emergence of JSON as a relatively compact serialization format that can be generated and parsed from almost any programming languages means it makes a great light weight interchange format.
Paralleling the big data explosion, is a growth in machine and infrastructure size. This means logging and the ability to spot errors in a distributed system has become even more valuable.
Logging objects instead of a format string enables you to more easily index and trace operations across hundreds of different machines and different software systems. With traditional format strings it is too fail deadly for the programmer to not log all the necessary information for a later operator to trace an operation.
Log Magic is a small and fast logging library for Node.js that I wrote early on for our needs at Rackspace. It only has a few features, and it is only about 300 lines of code.
Log Magic has the concept of a local logger instance, which is used by a single module for logging. A logger instance automatically populates information like the the facility
in a log entry. Here is an example of creating a logger instance for a module named 'myapp.api.handler
and using it:
{% highlight javascript %} var log = require(‘logmagic’).local(‘myapp.api.handler’);
exports.badApiHandler = function(req, res) { log.dbg(“Something is wrong”, {request: req}); res.end(); }; {% endhighlight %}
The second feature that Log Magic provides is what I call a “Log Rewriter”. This enables the programmer to just consistently pass in the request
object, and we will take care of picking out the fields we really want to log. In this example, we ensure the logged object always has an accountId
and txnId
fields set:
{% highlight javascript %} var logmagic = require(‘logmagic’); logmagic.addRewriter(function(modulename, level, msg, extra) { if (extra.request) { if (extra.request.account) { extra.accountId = extra.request.account.getKey(); } else { /* unauthenticated user */ extra.accountId = null; } extra.txnId = extra.request.txnId; delete extra.request; } return extra; }); {% endhighlight %}
The final feature of Log Magic is dynamic routes and sinks. For the purposes of this article, we are mostly interested in the graylog2-stderr
, which outputs a GELF JSON format message to stderr
:
{% highlight javascript %} var logmagic = require(‘logmagic’); logmagic.route(’root’, logmagic[‘DEBUG’], “graylog2-stderr”); {% endhighlight %}
With this configuration, if we ran that log.dbg
example from above, we would get a message like the following:
{% highlight javascript %} { “version”: “1.0”, “host”: “product-api0”, “timestamp”: 1324936418.221, “shortmessage”: “Something is wrong”, “fullmessage”: null, “level”: 7, “facility”: “myapp.api.handler”, ”accountId”: “ac42”, ”txnId”: “.rh-3dT5.h-product-api0.r-pVDF7IRM.c-0.ts-1324936588828.v-062c3d0” } {% endhighlight %}
There are many other libraries that are starting to emerge that can output logs in a JSON or GELF format:
stderr
instead of using UDP.One field we added very early on to our system was what we called the “Transaction Id” or txnId
for short. In retrospect, we could of picked a better name, but this is essentially a unique identifier that follows a request across all our of services. When a User hits our API we generate a new txnId
and attach it to our request
object. Any requests to a backend service also include the txnId
. This means you can clearly see how a web request is tied to multiple backend service requests, or what frontend request caused a specific Cassandra query.
We also send the txnId
to our user’s in our 500 error messages and the X-Response-Id
header, so if a user reports an issue, we can quickly see all of the related log entries.
While we treat the txnId
as an opaque string, we do encode a few pieces of information into it. By putting the current time and the origin machine into the txnId
, even if we can’t figure out what went wrong from searching for the txnId
, we have a place to start deeper debugging.
Since our product spans multiple data centers, and we don’t trust our LAN networking, our primary goal is that all log entries hit disk on their origin machine first. Some people have been using UDP or HTTP for their first level logging, and I believe this is a mistake. I believe having a disk default that consistently works is critical in a logging system. Once our messages have been logged locally, we stream them to an aggregator which then back hauls the log entries to various collection and aggregation tools.
Since all of our services run under runit, our programs simply log their JSON to stderr
, and svlogd takes care of getting the data into a local file. Then we use a custom tool written in Node.js that is like running a tail -F
on the log file, sending this data to a local Scribe instance. The Scribe instance is then responsible for transporting the logs to our log analyzing services.
For locally examining the log files generated by svlogd
, we also made a tool called gelf-chainsaw
. Since JSON strings cannot contain a newline, the log format is easy to parse, you just split up the file by \n
, and try to JSON.parse
each line. This is useful for our systems engineers when they are on a single machine, trying to debug an issue.
Once the logs crossing machines, there are many options to process those logs. Some examples that can all accept JSON as their input format:
For Rackspace Cloud Monitoring we are currently using Graylog2 with a patch to support Scribe as a transport written by @wirehead.
Bellow is an example of searching for specific txnId
in our system in Graylog2:
While this example is simple, we have some situations where a single txnId
spans multiple services, and the ability to trace all of them transparently is critical in a distributed system.
Write your logs for machines to process. Build tooling around those logs to transform them into something that is consumable by a human. Humans cannot process information in the massive flows that are created by concurrent and distributed systems. This means you should store the data from these systems in a format that enables innovative and creative ways for it to be processed. Right now, the best way to do that is to log in JSON. Stop logging with format strings.
]]>Cloudkick was primarily written in Python. Most backend services were written in Twisted Python. The API endpoints and web server were written in Django, and used mod_wsgi. We felt that while we greatly value the asynchronous abilities of Twisted Python, and they matched many of our needs well, we were unhappy with our ability to maintain Twisted Python based services. Specifically, the deferred programming model is difficult for developers to quickly grasp and debug. It tended to be ‘fail’ deadly, in that if a developer didn’t fully understand Twisted Python, they would make many innocent mistakes. Django was mostly successful for our needs as an API endpoint, however we were unhappy with our use of the Django ORM. It created many dependencies between components that were difficult to unwind later. Cloud Monitoring is primarily written in Node.js. Our team still loves Python, and much of our secondary tooling in Cloud Monitoring uses Python.
This attracted a few tweets, accusing various things about our developers, but I want to explore the topic in depth, and 140 characters just isn’t going to cut it.
We had about 140,000 lines of Python in Cloudkick. We had 40 Twisted Plugins. Each Plugin roughly corresponds to a backend service. About 10 of them are random DevOps tools like IRC bots and the like, leaving about 30 backend services that dealt with things in production. We built most of this code in a 2.5 year experience, growing the team from the 3 founders to about a dozen different developers. I know there are larger Twisted Python code bases out there, but I do believe we had a large corpus of experiences to build our beliefs upon.
This wasn’t just a weekend hack project and a blog post about how I don’t like deferreds, this was 2.5 years of building real systems.
Our Python code got the job done. We built a product amazingly quickly, built our users up, and were able to iterate quickly. I meant it when I said our team still still loves Python.
What I didn’t mention in the original post, is that after the acquisition, the Cloudkick team was split into two major projects — Cloud Monitoring, which the previous post was about, and another unannounced product team. This other product is being built in Django and Twisted Python. Cloud Monitoring has very different requirements moving forward — our goals are to survive and keep working after a truck drives into our data centers, and this is very different from how the original Cloudkick product was built.
Simply put, our requirements changed. These new requirements for Cloud Monitoring included:
Cloudkick was built as a startup. We took shortcuts. It scaled pretty damn well, but even if we changed nothing in our technology stack, it was clear we needed to refresh our architecture and how we modeled data.
The mixing of both blocking-world Django, and Twisted Python also created complications. We would have utility code that could be called from both environments. This meant extensive use of deferToThread
in order to not block Twisted’s reactor thread. This created an overhead for every programmer to understand both how Twisted worked, and how Django worked, even if your project in theory only involved the web application layer. Later on, we did build enough tooling with function decorators to reduce the impact of these multiple environments, but the damage was done.
I believe our single biggest mistake from a technical side was not reigning in our use Django ORM earlier in our applications life. We had Twisted services running huge Django ORM operations inside of the Twisted thread pool. It was very easy to get going, but as our services grew, not only was this not very performant, and it was extremely hard to debug. We had a series of memory leaks, places where we would reference a QuerySet, and hold on to it forever. The Django ORM also tended to have us accumulate large amounts of business logic on the model objects, which made building strong service contracts even harder.
These were our problems. We dug our own grave. We should’ve used SQLAlchemy. We should’ve built stronger service separations. But we didn’t. Blame us, blame Twisted, blame Django, blame whatever you like, but thats where we were.
We knew by April 2011 that the combination of new requirements and a legacy code base meant we needed to make some changes, but we also didn’t want to fall into a “Version 2.0” syndrome and over engineering every component.
We wanted some science behind this kind of decision, but unfortunately this decision is about programming languages, and everyone had their own opinions.
We wanted to avoid “just playing with new things”, because at the time half our team was enamored with Go Lang. We were also very interested in Python Gevent, since OpenStack Nova had recently switched to it from Twisted Python.
We decided to make a spreadsheet of the possible environments we would consider using for our next generation product. The inputs were:
We setup the spreadsheet so we could change the weight of each category. This let us play with our feelings, what if we only cared about developer velocity? What if we only cared about testability?
Our conclusion was, that it came down to was a choice between the JVM platform and Node.js. It is obvious that the JVM platform is one of the best ways to build large distributed systems right now. Look at everything Twitter, LinkedIn and others are doing. I personally have serious reservations about investing on top of the JVM, and Oracles recent behavior (here, here) isn’t encouraging.
After much humming and hawing, we picked Node.js.
After picking Node.js, other choices like using Apache Cassandra for all data storage were side effects — there was nothing like SQL Alchemy for Node.js at the time, so we were on our own either way, and Cassandra gave us definite improvements in operational overhead of compared to running a large number of MySQL servers in a master/slave configuration.
I think this is one of the first complaints people lob at Node.js when they just start. It makes a regular occurrence on the users mailing list — people think they want coroutines, generators or fibers.
I believe they are wrong.
The zen of Node.js is its minimalist core, both in size and in features. You can read the core lib Javascript in a day, and one more day for the C++. Don’t venture into v8 itself, that is a rabbit hole, but you can pretty quickly understand how Node.js itself works.
Our experience was that we just needed to pick one good tool to contain callback flows, and use it everywhere.
We use @Caolan’s excellent Async library. Our code is not 5 level deep nested callbacks.
We currently have about 45,000 lines of Javascript in our main repository. In this code base, we have used the async
library as our only flow control library. Our current use of the library in our code base:
async.waterfall
: 74async.forEach
: 55async.forEachSeries
: 21async.series
: 8async.parallel
: 4async.queue
: 3I highly suggest, that if you are unsure about Node.js and are going to do an experiment project, make sure you use Async, Step, or one of the other flow control modules for your experiment. It will help you better understand how most larger Node.js applications are built.
In the end, we had new requirements. We re-evaluated what platforms made sense for us to build a next generation product on. Node.js came out on top. We all have our biases, and our preferences, but I do believe we made a reasonable choice. Our goal in the end is still to move our product forward, and improve our business. Everything else is just a distraction, so pick your platform, and get real work done.
PS: If you haven’t already read it, read SubStack’s great the node.js aesthetic post.
]]>Rackspace Cloud Monitoring is based on technology built originally for the Cloudkick product. Some core concepts and parts of the architecture originated from Cloudkick, but many changes were made to enable Rackspace’s scalability needs, improve operational support, and focus the Cloud Monitoring product as an API driven Monitoring as a Service, rather than all of Cloudkick’s Management and Cloud Server specific features.
For this purpose, Cloudkick’s product was successful in vetting many parts of the basic architecture, and serving as a basis on which to make a reasonable second generation system. We tried to make specific changes in technology and architecture that would get us to our goals, but without falling into an overengineering trap.
Cloudkick was primarily written in Python. Most backend services were written in Twisted Python. The API endpoints and web server were written in Django, and used mod_wsgi. We felt that while we greatly value the asynchronous abilities of Twisted Python, and they matched many of our needs well, we were unhappy with our ability to maintain Twisted Python based services. Specifically, the deferred programming model is difficult for developers to quickly grasp and debug. It tended to be ‘fail’ deadly, in that if a developer didn’t fully understand Twisted Python, they would make many innocent mistakes. Django was mostly successful for our needs as an API endpoint, however we were unhappy with our use of the Django ORM. It created many dependencies between components that were difficult to unwind later. Cloud Monitoring is primarily written in Node.js. Our team still loves Python, and much of our secondary tooling in Cloud Monitoring uses Python. [
EDIT: See standalone post: The Switch: Python to Node.js]
Cloudkick was reliant upon a MySQL master and slaves for most of its configuration storage. This severely limited both scalability, performance and multi-region durability. These issues aren’t necessarily a property of MySQL, but Cloudkick’s use of the Django ORM made it very difficult to use MySQL radically differently. The use of MySQL was not continued in Cloud Monitoring, where metadata is stored in Apache Cassandra.
Cloudkick used Apache Cassandra primarily for metrics storage. This was a key element in keeping up with metrics processing, and providing a high quality user experience, with fast loading graphs. Cassandra’s role was expanded in Cloud Monitoring to include both configuration data and metrics storage.
Cloudkick used the ESPER engine and a small set of EPL queries for its Complex Event Processing. These were used to trigger alerts on a monitoring state change. ESPER’s use and scope was expanded in Cloud Monitoring.
Cloudkick used the Reconnoiter noitd
program for its poller. We have contributed patches to the open source project as needed. Cloudkick borrowed some other parts of Reconnoiter early on, but over time replaced most of the Event Processing and data storage systems with customized solutions. Reconnoiter’s noitd
poller is used by Cloud Monitoring.
Cloudkick used RabbitMQ extensively for inter-service communication and for parts of our Event Processing system. We have had mixed experiences with RabbitMQ. RabbitMQ has improved greatly in the last few years, but when it breaks we are at a severe debugging disadvantage, since it is written in Erlang. RabbitMQ itself also does not provide many primitives we felt we needed when going to a fully multi-region system, and we felt we would need to invest significantly in building systems and new services on top of RabbitMQ to fill this gap. RabbitMQ is not used by Cloud Monitoring. Its use cases are being filled by a combination of Apache Zookeeper, point to point REST or Thrift APIs, state storage in Cassandra and changes in architecture.
Cloudkick used an internal fork of Facebook’s Scribe for transporting certain types of high volume messages and data. Scribe’s simple configuration model and API made it easy to extend for our bulk messaging needs. Cloudkick extended Scribe to include a write ahead journal and other features to improve durability. Cloud Monitoring continues to use Scribe for some of our event processing flows.
Cloudkick used Apache Thrift for some RPC and cross-process serialization. Later in Cloudkick, we started using more JSON. Cloud Monitoring continues to use Thrift when we need strong contracts between services, or are crossing a programing language boundary. We use JSON however for many data types that are only used within Node.js based systems.
We have been very happy with our choice of using Node.js. When we started this project, I considered it one of our biggest risks to being successful — what if 6 months in we are just mired in a new language and platform, and regretting sticking with the known evil of Twisted Python. The exact opposite happened. Node.js has been an awesome platform to build our product on. This is in no small part to the many modules the community has produced.
Here it is, the following is the list of NPM modules we have used in Cloud Monitoring, straight from our package.json:
Now that our product is announced, I’m hoping to find a little more time for writing. I will try to do more posts about how we are using Node.js, and the internals of Rackspace Cloud Monitoring’s architecture.
PS: as always, we are hiring at our sweet new office in San Francisco, if you are interested, drop me a line.
]]>